Vim, Go and Remote Debugging

Setting up Vim for remotely debugging Go code
Introduction
While developing Log4Shell Sentinel, I found myself having to debug my Go application in different environments, with each environment running a unique combination of a container runtime (Docker, CRI-O, Containerd) and storage driver (overlay2, aufs, etc.). I decided to use Vim (if you’re not currently using Vim, then I’d recommend that you seriously reconsider your life choices) and Fatih’s excellent vim-go plugin which gives me many of the features I would get from a full blown IDE. However, I didn’t run into many useful tutorials on setting up remote debugging, so I decided to quickly the steps I took. Although there are other Vim plugins to integrate delve - the most popular Go debugger - such as vim-delve, I’ve found Fatih’s plugin to be the best option.
Preparing the Environment
There are two sides to my setup:
- the development / Vim session with my source code
- the remote host running my Go binary
Development Side
For my development side, I simply need to install delve and the vim-go plugin. On my first run of Vim after installing the plugin, I had to run :GoInstallBinaries to download and install Go tool binaries such as gopls, goimports, etc as they were not all installed on the system. Once installed, debugging a simple Go application such as this:
package main

import "fmt"

func main() {
  a := 5
  fmt.Println(a)
}
is as simple as moving to the line I want to run to and then issuing the following command:
:GoDebugStart
followed by this command once the debugger UI is displayed:
:GoDebugContinue
This tells the debugger to break on the current line. The Vim session will now look like this:
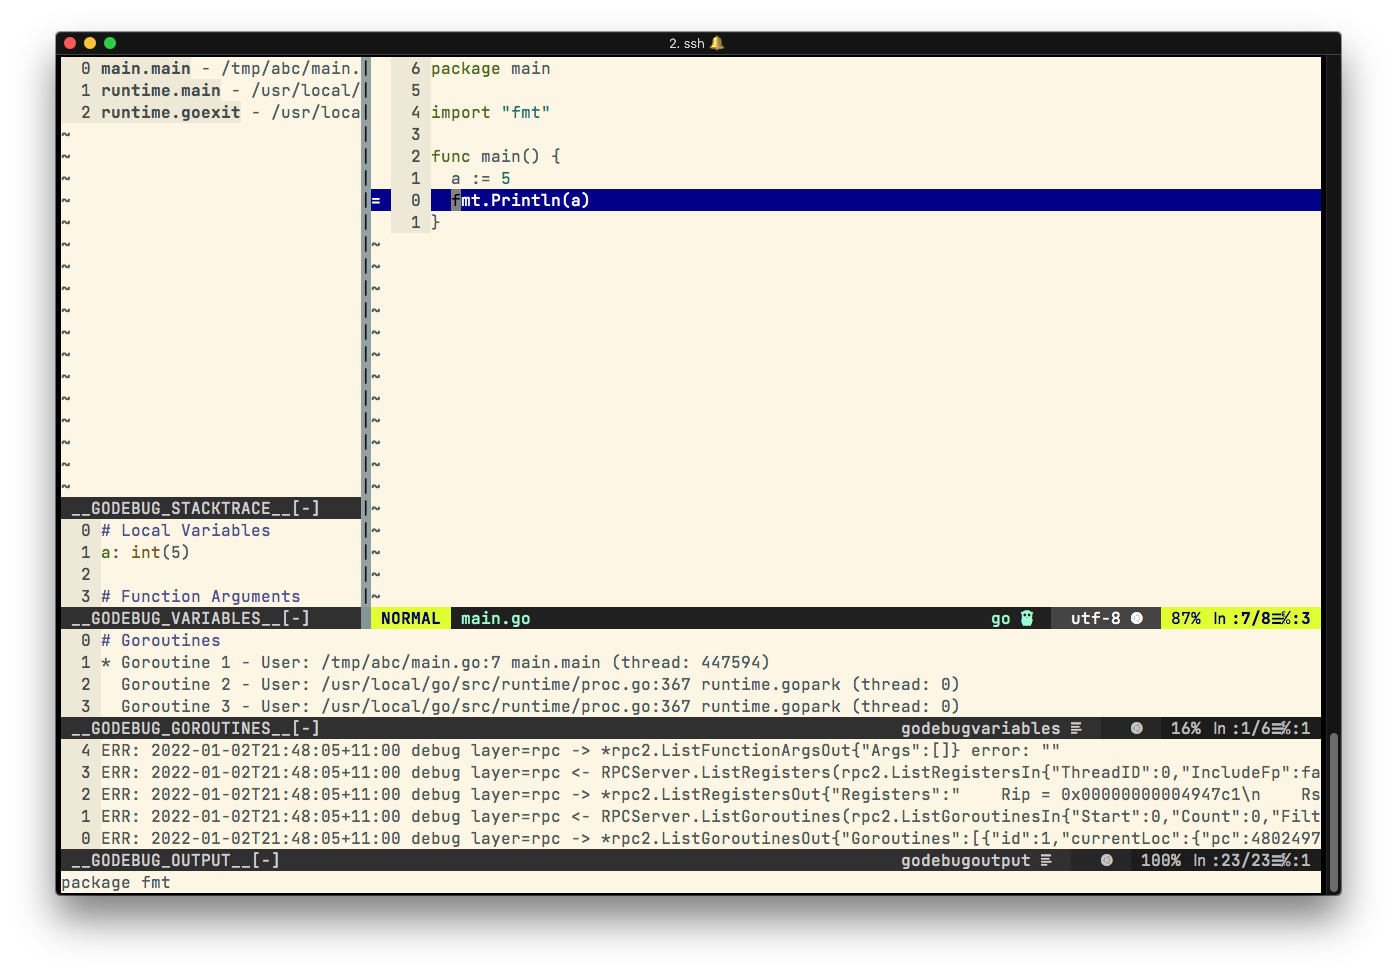
By default, it shows us the following four panes:
- Stacktrace
- Variables
- Go routines
- Godebug output
The default panes and pane arrangement isn’t ideal in my opinion. For example, the GoDebug output is rarely useful and I prefer having all my tab-related panes on one side. As I’m not currently using Go routines, I’ll remove that pane as well. I’ll add the following snippet to my ~/.vimrc file:
let g:go_debug_windows = {
      \ 'vars':       'rightbelow 50vnew',
      \ 'stack':      'rightbelow 10new',
      \ }
      " \ 'goroutines':      'rightbelow 10new',
which instructs the plugin to display a 50-character wide pane on the right for variables followed by the stack. If I needed to debug Go routines, I can uncomment the commented goroutines line above and add it to the array. The debug window now looks like this:
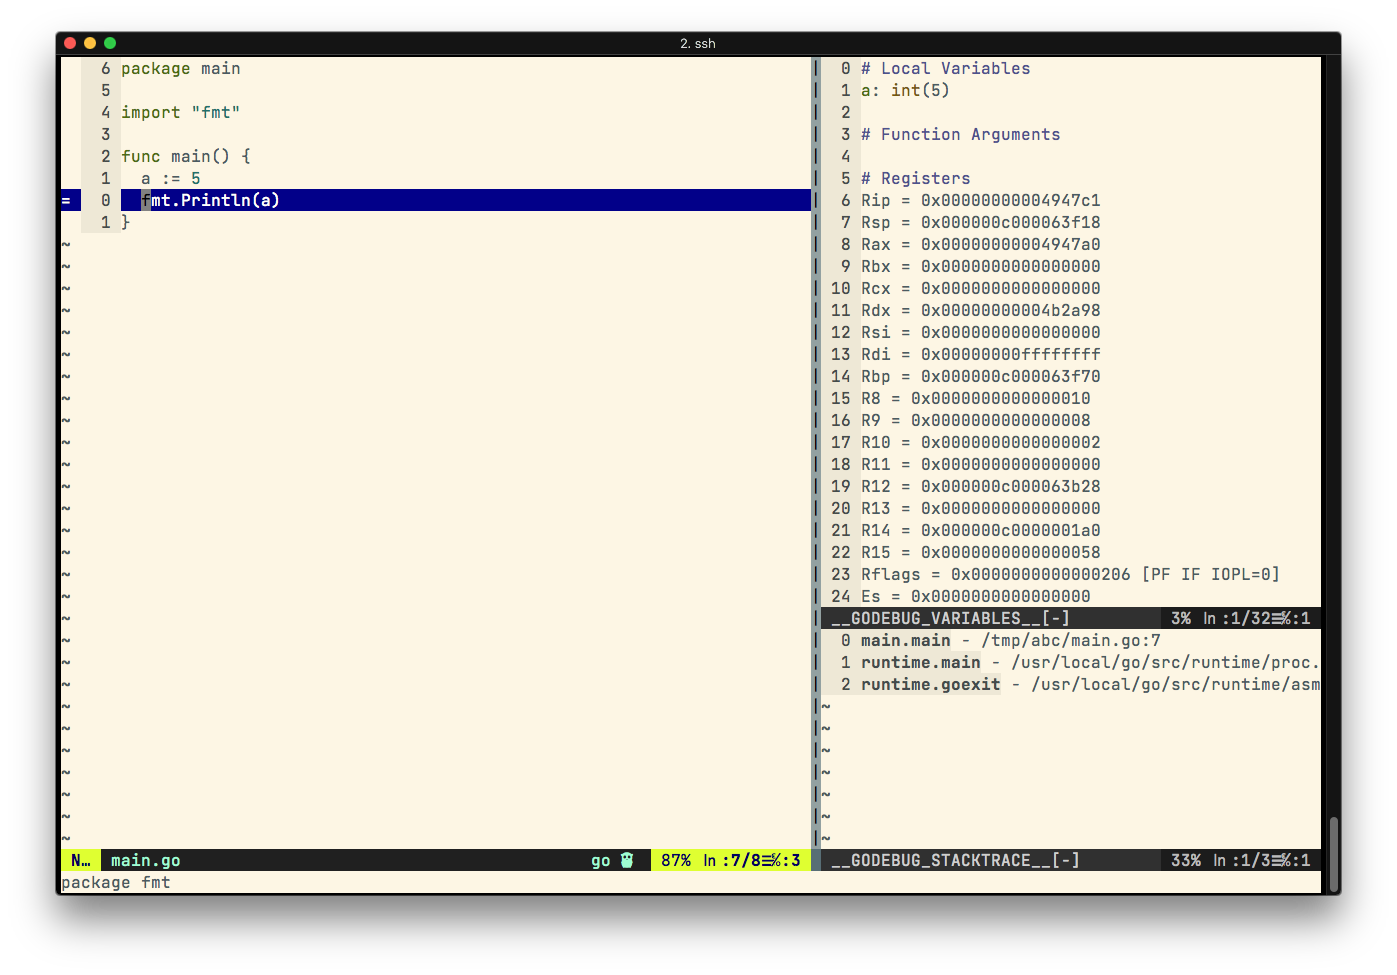
However, I don’t find the Registers section useful while debugging and found it distracting. There is no Vim variable or option to remove it so I’ll directly comment out the following lines in ~/.vim/autoload/go/debug.vim instead:
let v += ['']
let v += ['# Registers']
if type(get(s:state, 'registers', [])) is type([])
  for c in s:state['registers']
    let v += [printf("%s = %s", c.Name, c.Value)]
  endfor
endif
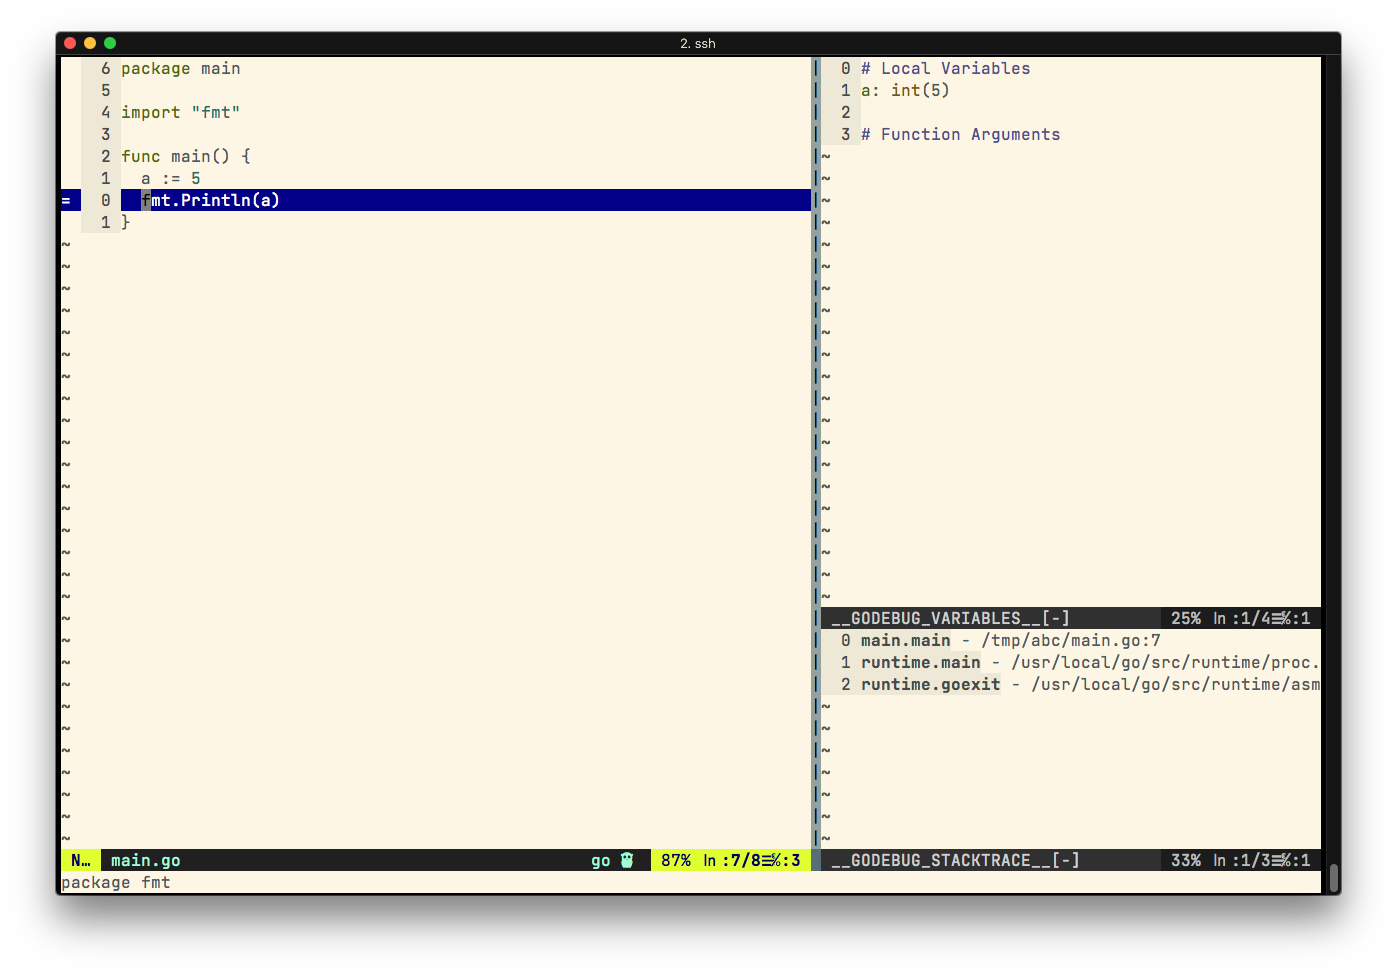
There may be a cleaner way to do this that I’m not aware of. The debug UI is now much clearer and now looks like this:
Now that the UI-side is more to my liking, it is time to configure key-bindings. By default, vim-go has typical debugger key-bindings:
- F5 = continue
- F9 = add breakpoint
- F8 = halt
- F10 = next
- F11 = step in
However, these keys are often already mapped to other system-related actions and I prefer to use more Vim-like key-bindings as shown below:
let g:go_debug_mappings = {
      \ '(go-debug-continue)': {'key': 'c', 'arguments': '<nowait>'},
      \ '(go-debug-next)': {'key': 'n', 'arguments': '<nowait>'},
      \ '(go-debug-step)': {'key': 's'},
      \ '(go-debug-print)': {'key': 'p'},
  \}
Now, when the debugger is running, I have the following mappings:
- c = continue
- p = print value (it prints the value of any variable the cursor hovers over)
- n = next
- s = step in
I also added the following key-bindings to quickly invoke the debugger, stop the debugger and toggle a breakpoint:
map <leader>ds :GoDebugStart<cr>
map <leader>dt :GoDebugStop<cr>
map <leader>db :GoDebugBreakpoint<cr>
So a typical debug session would start by <leader>ds followed by pressing c while in debugger mode to break on the current line (or I can manually add breakpoints using <leader>db).
Remote Side
To debug my Go binary on remote hosts, I need to:
- build my binary without removing debugging data. This is the default so nothing changes
- copy over the dlv/delve binary to the remote systems
For the later, I’ll compile delve statically to make sure that I don’t run into any GLIBC-related issues:
$ CGO_ENABLED=0 go get github.com/go-delve/delve/cmd/dlv
I then copy over both of these to the remote host.
Remote Debugging
Having copied the delve binary and my Go binary to the remote host, I can start a remote debugging session by running delve on the remote host:
$ sudo ./dlv --listen="0.0.0.0:40000" --headless=true --api-version=2 --accept-multiclient exec ./log4shell_sentinel -- -p /
API server listening at: [::]:40000
This configures delve to listen on port 40000 for connections. Using --, I can pass parameters to my executable. On my development machine, I open my source code file in Vim and run:
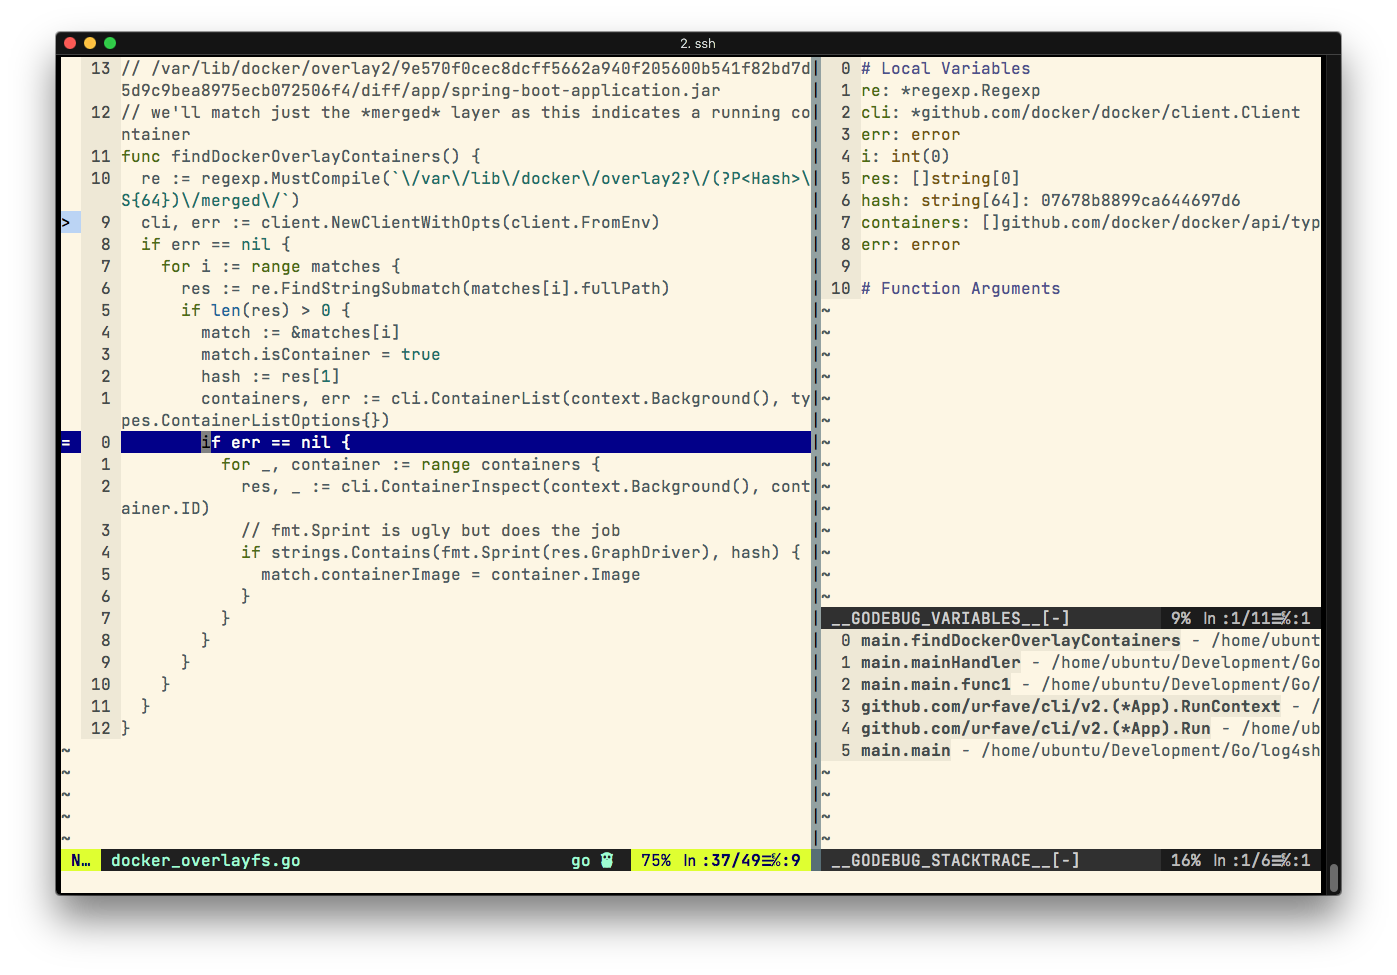
:GoDebugConnect 192.168.1.110:40000
to connect to the delve debugger. I can now proceed by running c to continue execution until execution hits the line I am currently on:
Conclusion
In this short blog post, we looked at how to setup Vim for remote Go debugging. I hope you’ve found the post useful. Until next time.