Advanced Nmap NSE Script Debugging
Learn how to debug Nmap NSE scripts like a pro
Introduction
TLDR: If you’ve ever wanted to get runtime visibility into what an Nmap NSE script is actually doing or you’re trying to troubleshoot why a given NSE script isn’t working as expected, you’ve had very limited options to do so. Until now. This blog post looks at how to attach your NSE script to a Lua debugger and get full visibility to what your script is doing.
When Nmap was first released in 1997, it was a simple network port scanner. All it did was check if a port was open or not using a variety of techniques (refer to the original Phrack article for more). Over time, additional features were added, including OS detection and service/version detection. However, what really set it apart from other scanners was the introduction of the Nmap Scripting Engine in 2006. For the first time, users could write and share scripts to automate common network scanning tasks in Lua. Lua is a lightweight, easy to learn programming language often embedded in other applications to allow users to extend them. You’ll find Lua support in a number of security and infrastructure tools including: Nmap, Suricata, Snort, Wireshark, ModSecurity, HAproxy, nginx / OpenResty and Redis, to name a few. The official NSE repository currently has over 600 NSE scripts with many more available in GitHub repositories and other repositories. You have:
- auth scripts to perform default password checks, in addition to detecting authentication schemes used
- broadcast scripts used to discover devices, servers and applications running in your network
- brute force scripts to performs password guessing for various applications
- discovery scripts to actively discover more about your the network including web services, file shares, and directory services
- exploit scripts that attempt to actively exploiting vulnerable services
- fuzzer scripts to fuzz services and protocols
- version scripts to determine the version of a specific application or service
- vuln scripts which check for known vulnerabilities
and more.
While this blog post won’t delve into NSE script development, it can be helpful to provide readers with references to some valuable resources. Nmap comes with dozens of supporting libraries and protocol helpers to allow you to easily work with various protocols including SSH, RDP, SMB, LDAP, HTTP, DHCP, DNS, EAP, MSRPC, AMQP, Cassandra, and others. You can also extend this list with third-party Lua libraries. If you’re interested, I’d highly recommend Peter Kacherginsky’s fantastic article on the topic which you can find here. To learn Lua basics, I’d recommend a short primer on Lua which you can find here: Learn Lua in X Minutes. For more Lua, I’d recommend Lua Quick Start Guide: The Easiest Way to Learn Lua Programming and if you really want to dive deep into Lua, I’d recommend link: Programming in Lua, Fourth Edition.
What this blog post will look at is how to debug NSE scripts and get real runtime visibility into what any given NSE script does. Despite the widespread use of NSE scripts, this is one area where Nmap doesn’t provide you with any good options. Being able to understand what a given Nmap script does is useful for a number of reasons including:
- learning how a given script actually works
- debugging why a given script isn’t working as expected
- helping you to learn to write your own scripts
But first, we’ll look at what Nmap provides out of the box and why this isn’t sufficient.
Why the Default Aren’t Enough
To get some level of visibility into what our NSE script does and why, we have two options:
-d--script-trace
-d adds debug information to nmap’s output. For example:
# nmap -p 80 scanme.nmap.org --script http-methods -d
Starting Nmap 7.93 ( https://nmap.org ) at 2023-09-25 23:54 UTC
...
NSE: Script scanning 45.33.32.156.
...
NSE: Starting http-methods against scanme.nmap.org (45.33.32.156:80).

NSE: [http-methods 45.33.32.156:80] HTTP Status for OPTIONS is 200
NSE: [http-methods 45.33.32.156:80] Response Code to Random Method is 501

NSE: Finished http-methods against scanme.nmap.org (45.33.32.156:80).
...
The NSE: [http-methods ...] lines are printed due to the use of -d. What this actually does is print any stdnse.debugX statements in our NSE script, where X is a debug level (this can be 1, 2 or not specified). For more on stdnse.debug, refer to the official documentation.
The below extract from http-methods.nse shows the code that triggered the debug statements:
  -- cut

  response = http.generic_request(host, port, "OPTIONS", path)
  if not response.status then
    options_status = false
    stdnse.debug1("OPTIONS %s failed.", path)
  end
  -- Cache in case retest is requested.
  if options_status then
    options_status_line = response["status-line"]
    stdnse.debug1("HTTP Status for OPTIONS is " .. response.status)
    if not(response.header["allow"] or response.header["public"]) then
      stdnse.debug1("No Allow or Public header in OPTIONS response (status code %d)", response.status)
    end
  end

  -- cut

  if random_resp.status then
    stdnse.debug1("Response Code to Random Method is %d", random_resp.status)
  else
    stdnse.debug1("Random Method %s failed.", path)
  end
The output we see when we used -d:
NSE: [http-methods 45.33.32.156:80] HTTP Status for OPTIONS is 200
was due to this statement:
stdnse.debug1("HTTP Status for OPTIONS is " .. response.status)
and so on.
On the other hand, --script-trace gives us more raw output and isn’t as selective. For example:
# nmap -p 80 scanme.nmap.org --script http-methods --script-trace
would result in a lot of raw output such as:
...
NSOCK INFO [1.2020s] nsock_connect_tcp(): TCP connection requested to 45.33.32.156:80 (IOD #2) EID 32
NSOCK INFO [1.3690s] nsock_trace_handler_callback(): Callback: CONNECT SUCCESS for EID 32 [45.33.32.156:80]
NSE: TCP 172.17.0.4:37742 > 45.33.32.156:80 | CONNECT
NSE: TCP 172.17.0.4:37742 > 45.33.32.156:80 | 00000000: 4f 50 54 49 4f 4e 53 20 2f 20 48 54 54 50 2f 31 OPTIONS / HTTP/1
00000010: 2e 31 0d 0a 48 6f 73 74 3a 20 73 63 61 6e 6d 65 .1  Host: scanme
00000020: 2e 6e 6d 61 70 2e 6f 72 67 0d 0a 43 6f 6e 6e 65 .nmap.org  Conne
00000030: 63 74 69 6f 6e 3a 20 63 6c 6f 73 65 0d 0a 55 73 ction: close  Us
00000040: 65 72 2d 41 67 65 6e 74 3a 20 4d 6f 7a 69 6c 6c er-Agent: Mozill
00000050: 61 2f 35 2e 30 20 28 63 6f 6d 70 61 74 69 62 6c a/5.0 (compatibl
00000060: 65 3b 20 4e 6d 61 70 20 53 63 72 69 70 74 69 6e e; Nmap Scriptin
00000070: 67 20 45 6e 67 69 6e 65 3b 20 68 74 74 70 73 3a g Engine; https:
00000080: 2f 2f 6e 6d 61 70 2e 6f 72 67 2f 62 6f 6f 6b 2f //nmap.org/book/
00000090: 6e 73 65 2e 68 74 6d 6c 29 0d 0a 0d 0a          nse.html)

NSOCK INFO [1.3690s] nsock_write(): Write request for 157 bytes to IOD #2 EID 43 [45.33.32.156:80]
NSOCK INFO [1.3690s] nsock_trace_handler_callback(): Callback: WRITE SUCCESS for EID 43 [45.33.32.156:80]
...
However, neither -d or --script-trace is ideal due to, in the case of -d:
- requiring that the script author add the necessary
stdnse.debugstatements - requiring that the script author output the variables that we are interested in
- does not print out variables that we may be interested in such as the NSE registry
and in the case of --script-trace:
- the output is difficult to process
- you can’t view the values of individual variables
Neither of them also gives us the option to pause execution and inspect any variable at runtime. A better option is to attach Nmap to a real Lua debugger which we’ll look at next.
Using Real Debuggers
Instead of depending on -d or --script-trace, a much better option is to attach Nmap to a Lua debugger to debug NSE scripts. The two we’ll look at are:
- ZeroBrane Studio, a Lua IDE
- debugger.lua, a CLI-based debugger for CLI aficionados
There are other options as well but these cover our needs nicely. When looking at these two options, we’ll use the http-methods NSE script as an example, but this will work for any NSE script.
ZeroBrane Studio
1 - Installing ZeroBrane Studio
ZeroBrane Studio is the most popular Lua IDE and describes itself as a “lightweight Lua IDE with code completion, syntax highlighting, live coding, code analyzer, and debugging support for Lua 5.1, Lua 5.2, Lua 5.3, Lua 5.4, LuaJIT, and other Lua engines”. To download it for free, simply visit the Download page and click on the “Take me to the download page this time” option. It has packages for:
- Windows
- macOS
- Linux
Installation is straight-forward. Once installed, launch it to ensure that it was properly installed. If you find ZeroBrane Studio useful, it would be great if you could contribute to the project financially to help further development of the project.
The remaining steps involve:
- configuring Nmap
- updating the NSE script we want to debug
- configuring ZeroBrane Studio
- running Nmap
2 - Configuring Nmap
Our setup will vary slightly based on whether we run nmap locally or within a Docker container.
2a - Local Installation
We first:
- Locate the
nselib/directory (on Ubuntu, this is located under/usr/share/nmap/nselib) Find the
mobdebug.luafile (this is part of ZeroBrane Studio) and make a copy of it. MobDebug is a remote debugger for Lua which means it allows us to connect Lua code running remotely back to our Lua debugger. On Linux, we can find it at/opt/zbstudio/lualibs/mobdebug/mobdebug.lua:cp /opt/zbstudio/lualibs/mobdebug/mobdebug.lua /tmp/We then want to modify
mobdebug.luaand add the following three lines at the top:local getfenv = nil local setfenv = nil local loadstring = nilThe first few lines of our modified
mobdebug.luanow look like this:-- -- MobDebug -- Lua remote debugger -- Copyright 2011-20 Paul Kulchenko -- Based on RemDebug 1.0 Copyright Kepler Project 2005 -- local getfenv = nil local setfenv = nil local loadstring = nil -- use loaded modules or load explicitly on those systems that require that local require = require local io = io or require "io" ...The reason this is required is that NSE runs Lua in strict mode which requires that all variables be initialized to valid values.
Copy the new file to Nmap’s
nselib/directory:sudo cp /tmp/mobdebug.lua /usr/share/nmap/nselib/
Our next step is ensuring that luasocket, which adds networking support to Lua, is installed as this too is needed to allow mobdebug connect back to our debugger. To install it, we have to first determine what version of Lua our nmap installation uses:
$ nmap -version
Nmap version 7.80 ( https://nmap.org )
Platform: x86_64-pc-linux-gnu
Compiled with: liblua-5.3.6 openssl-3.0.2 nmap-libssh2-1.8.2 libz-1.2.11 libpcre-8.39 libpcap-1.10.1 nmap-libdnet-1.12 ipv6
Compiled without:
Available nsock engines: epoll poll select
The above output tells us that it currently uses Lua 5.3. We could also grab it using this one-liner:
$ nmap -version | grep -i -Po 'lib\Klua-\d.\d'
lua-5.3
We then proceed to install lua-5.3 and the lua-5.3 development libraries. On Ubuntu / Debian, we run:
sudo apt install -y lua5.3 liblua5.3-dev
and then install luarocks and use it to install the luasocket package:
sudo apt install -y luarocks
sudo luarocks install luasocket --lua-version=5.3
If we’re using Fedora, we would require a few additional steps. Unlike Ubuntu which provides us with a number of installable Lua versions, we aren’t as fortunate with Fedora. While we can find pre-packaged RPMs at Fedora Copr, knowing how to building our own is useful. The example below is based on the official Fedora docker image. If you are applying this to a standard Fedora installation, you would tweak it slightly:
#!/bin/bash

# install nmap + some requirements
dnf install -y make gcc readline-devel luarocks nmap

# download and build it
curl -O http://www.lua.org/ftp/lua-5.3.5.tar.gz
tar zxf lua-5.3.5.tar.gz
cd lua-5.3.5
make linux test

# package it as an RPM (optional)
dnf install -y ruby ruby-devel rpm-build
gem install fpm
mkdir /tmp/project
# install it to /tmp/project
sudo make DESTDIR=/tmp/project install
# packages it to an RPM and install it
fpm -s dir -t rpm -C /tmp/project --name lua --version 5.3.20230801 --iteration 1 --description "Custom Lua 5.3 Installation" .

# install luasocket
luarocks install luasocket --lua-version=5.3

# link it
ln -s /root/.luarocks/share/lua/5.3/socket.lua /usr/local/lib/lua/5.3/socket.lua
mkdir /usr/local/lib/lua/5.3/socket
ln -s /root/.luarocks/lib64/lua/5.3/socket/core.so /usr/local/lib/lua/5.3/socket/core.so
We’ve now done the heavy lifting and we can proceed to update our NSE script and start debugging.
2b - Docker
If we prefer to not modify our Nmap installation or want to use the most up-to-date version which may not be in our package repository, we can use a Docker image instead. To do so, we’ll use the popular instrumentisto/nmap image, as it regularly updated. To do so, we would do the following:
Download the image:
docker pull instrumentisto/nmapCreate a directory used to share NSE scripts between ZeroBrane Studio running on our host and our container (even if you modify the NSE script within your container, you’ll still want to open it in ZeroBrane Studio to debug it):
$ mkdir /tmp/scriptsRun our container:
$ docker run --rm -it --name nmap --entrypoint /bin/sh -v /tmp/scripts:/tmp/scripts/ instrumentisto/nmapIn another terminal, modify our
mobdebug.luafile (refer to the above section on what modifications are needed) and then copy the modified file over to our Docker container:$ docker cp /tmp/mobdebug.lua nmap:/usr/share/nmap/nselib/Within our container, we install the necessary dependencies:
# apk add lua5.3 lua5.3-dev luarocks gcc musl-dev
# luarocks-5.3  install luasocket --lua-version=5.3
We’ve now done the heavy lifting and we can now proceed to update our NSE script and start debugging.
3 - Updating Our NSE Script
Depending on if we are running nmap locally or remotely or in a Docker container, the line that we add to our NSE script will be slightly different.
Local Installation
To tell our NSE script to connect back to ZeroBrane Studio, we have to add the following line to our NSE script:
require('mobdebug').start()
Where should we place this? Any NSE script is split up into various sections. The following skeleton highlights these sections:
-- The Head Section --
description = [[
  Example
]]
author = "@example"

-- The Rule Section --
portrule = function(host, port)
    return port.protocol == "tcp"
            and port.number == 80
            and port.state == "open"
end

-- The Action Section --
action = function(host, port)
    return "Hello world!"
end
We have three sections:
| Section | Details |
|---|---|
| Head | The Head section adds metadata related such as the name of the author, what category the script falls under, and so on. |
| Rule | The Rule section determines when the script is run (if a given port is open or a specific service is detected). If the portrule function returns True, then the action section will run. In the above skeleton, the 3 conditions specified must be True for the action section to run. |
| Action | The Action section is the actual section that is run if we have a rule match. |
We can place our debug statement anywhere within the Action section. However, it is recommended that we place your debug statement after any network-related calls due to issues covered in the Caveats section. For example, in our sample script http-methods.nse, we see the following:
action = function(host, port)
  require('mobdebug').start("172.17.0.1")

  -- cut

  response = http.generic_request(host, port, "OPTIONS", path)
  if not response.status then
    options_status = false
    stdnse.debug1("OPTIONS %s failed.", path)
  end

  -- cut
Placing our require('mobdebug').start() after the response = http.generic_request(host, port, "OPTIONS", path) is recommended.
NOTE If you prefer not to modify an NSE script, make a copy of it and modify the copy. Then use --script to point to it. For example:
cp /usr/share/nmap/scripts/http-methods.nse /tmp/
and then modify /tmp/http-methods.nse and run it as follows:
# nmap -p 80 ... --script /tmp/http-methods.nse
Running nmap On a Different Machine
If we wish to run nmap on a different machine while debugging locally, we could do so by either:
updating the
require('mobdebug')and passing in our local machine’s IP address. For example:require('mobdebug').start("192.168.10.50")NOTE port
8172has to be accessible from the instance running nmap to your machine so make sure to add any necessary firewall rules.using SSH reverse tunnelling. For example:
$ ssh -nNT -R 8172:localhost:8172 vagrant@192.168.121.5
Docker
If we are running Nmap in a Docker container, we would:
- copy our NSE script to
/tmp/scripts/(either in our container or on our host as this directory is shared between the two) update it and add the following line where
172.17.0.1points to our host (this is the IP your host gets in a default Docker installation):require('mobdebug').start("172.17.0.1")
4 - Configuring ZeroBrane Studio
We’re almost ready. Back in ZeroBrane Studio, we’ll:
- add syntax highlighting to our NSE scripts
- configure it to show all our variables including the NSE Registry by enabling the Stack Window
To add syntax highlighting to our NSE scripts, we would open ZeroBrane Studio and enable syntax highlighting for files with the .nse extension. To do so, go to Edit -> Preferences -> Settings: Users and then add the following:
  local luaspec = ide.specs.lua
  luaspec.exts[#luaspec.exts+1] = "nse"
and then restart ZeroBrane Studio and it will treat any file with a .nse extension as a .lua file.
To add the Stack Window, we would:
- Go to View -> Stack Window
- Move the new window to the left pane so it is inserted there
5 - Running Our NSE Script
Now that everything is in place, we have three final tasks:
- opening our NSE script in ZeroBrane Studio. Make sure you open the modified script with the
require('mobdebug')statement - running nmap and telling it to run our script
- we also have to run the Debugger twice to have it start listening on port 8172 and accepting connections by clicking on the “Start or continue Debugging (F5)” twice. We would have to run this once each time we start up ZeroBrane Studio.
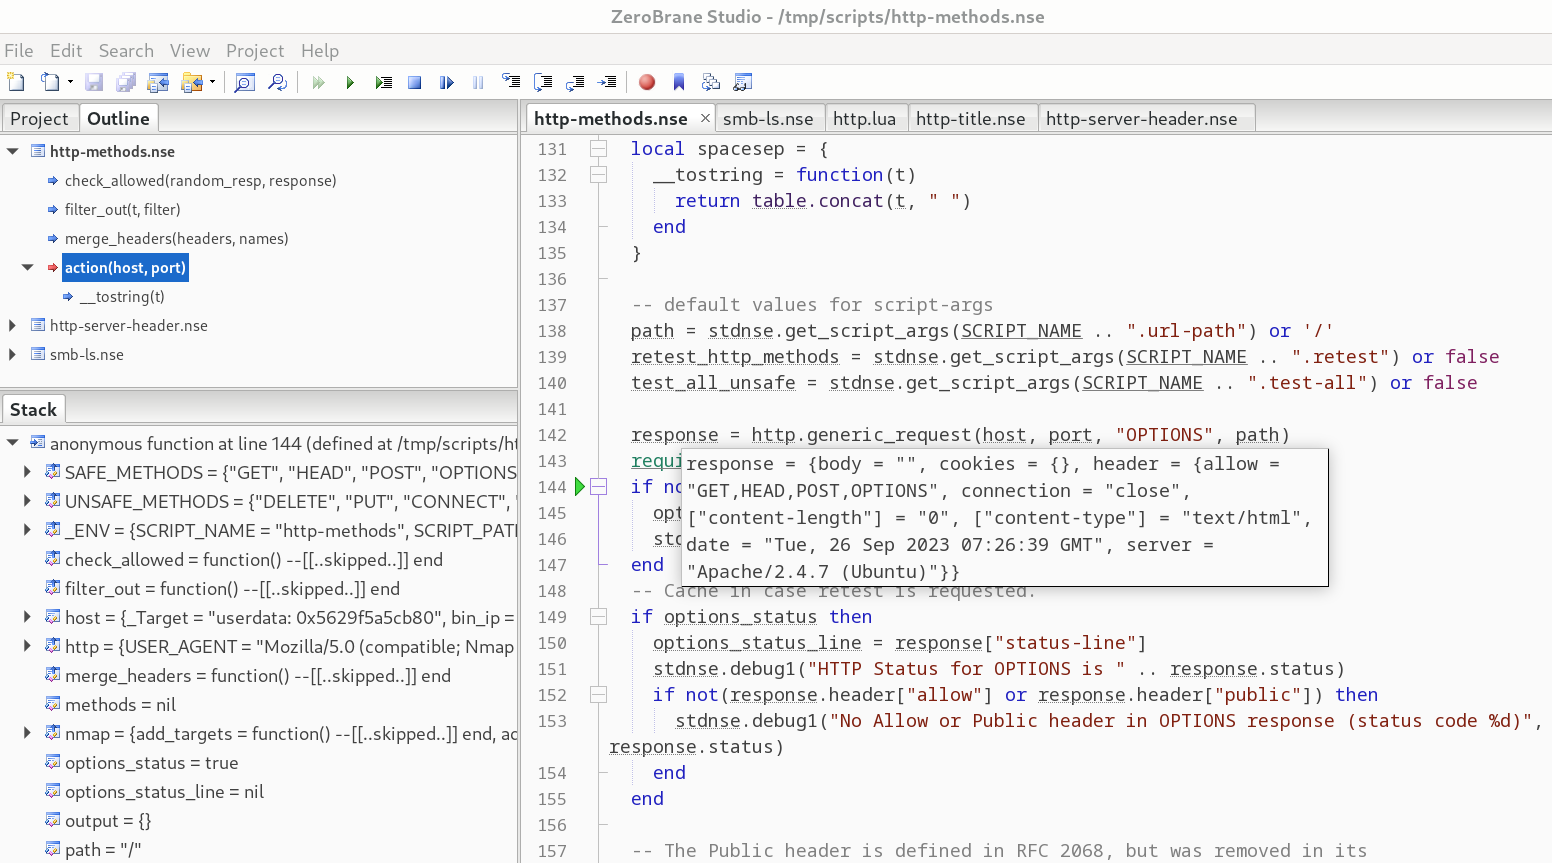
For example, if we modified http-methods.nse and then run:
nmap -T4 -p 80 192.168.1.1 -d --script /tmp/http-methods.nse
in ZeroBrane Studio, we would see the following:
and have full access to step over statements, step into them, and so on.
debugger.lua - A CLI Debugger
If you are more comfortable in the CLI, you’re in luck. Using debugger.lua, we can debug our NSE scripts. There are other CLI debuggers but debugger.lua is fine for our needs. While using ZeroBrane Studio is more convenient, you may find yourself in a position where you can’t use it or you may just prefer to do everything in the CLI.
To use it, we would do the following:
Download it:
curl -O https://raw.githubusercontent.com/slembcke/debugger.lua/master/debugger.luaWe then need to modify it due to Nmap running Lua in strict mode which requires that all variables be initialied. To comply with this requirement, we add the following lines at the beginning our
debugger.luafile:local unpack = nil local jit = nilWe then copy it to our
nselib/directory:sudo cp debugger.lua /usr/share/nmap/nselib/
To then use it to debug any NSE script, we would edit our NSE script and:
Add the following at the top of our script (or anywere as long as it is before our next statement):
local dbg = require "debugger"Add the following anywhere we want to (again, this should be within the action section as previously mentioned):
dbg()
For where to place the dbg() statement, refer to the ZeroBrane Studio section which covers this. We’ll use the same example we used previously and make a copy of http-methods.nse and modify it by adding our two lines after our HTTP request:
  response = http.generic_request(host, port, "OPTIONS", path)
  local dbg = require "debugger"
  dbg()
When we then run Nmap, we’ll be dropped into our debugger when it runs into the dbg() statement. For example, if we run:
nmap -T4 -p 80 192.168.1.1 -d --script /tmp/http-methods.nse
as soon as execution runs to our dbg() statement, we’ll be dropped into our debugger:
Starting Nmap 7.93 ( https://nmap.org ) at 2023-09-26 09:05 UTC
Stats: 0:00:05 elapsed; 0 hosts completed (1 up), 1 undergoing Script Scan
NSE Timing: About 0.00% done
debugger.lua: Loaded for Lua 5.3
break via dbg() => /tmp/http-methods.nse:146 in chunk at /tmp/http-methods.nse:124
debugger.lua>
However, if we type anything, we don’t see our input. This is due to Lua running in embedded mode and Nmap itself controlling stdin. To get control back of this, we can run the following:
e os.execute("stty echo cooked")
This calls the stty command to reset stdin and get back echo support so we can see what we’re typing. To see the available commands, we can type h <ENTER>:
debugger.lua> h
  <return> => re-run last command
  c(ontinue) => continue execution
  s(tep) => step forward by one line (into functions)
  n(ext) => step forward by one line (skipping over functions)
  f(inish) => step forward until exiting the current function
  u(p) => move up the stack by one frame
  d(own) => move down the stack by one frame
  w(here) [line count] => print source code around the current line
  e(val) [statement] => execute the statement
  p(rint) [expression] => execute the expression and print the result
  t(race) => print the stack trace
  l(ocals) => print the function arguments, locals and upvalues.
  h(elp) => print this message
  q(uit) => halt execution
To dump all local variables, we can use l:
  ...
  port => {"protocol" = "tcp", "number" = 80, "state" = "open", "reason" = "syn-ack", "reason_ttl" = 63, "version" = {"name_confidence" = 3.0, "name" = "http", "service_dtype" = "table", "cpe" = {}, "service_tunnel" = "none"}, "service" = "http"}
  ...
However, as this is difficult to see in one go, we can instead print a single variable such as port by using p:
debugger.lua> p port
port => {"reason" = "syn-ack", "service" = "http", "version" = {"name_confidence" = 3.0, "service_tunnel" = "none", "cpe" = {}, "service_dtype" = "table", "name" = "http"}, "state" = "open", "reason_ttl" = 63, "protocol" = "tcp", "number" = 80}
To pretty printed the output and make it more readable and not have to reset stdin every time we run it, we can do the following:
- Quit the current session (
q) Edit
debugger.luaand add the following line at the top:os.execute("stty echo cooked")Download pprint
curl -O https://raw.githubusercontent.com/jagt/pprint.lua/master/pprint.lua- We can place it under
nselib/or nmap’sscripts/directory or in our current directory
To then use it, we would re-run our nmap scan and then:
debugger.lua> e _G.pprint = require("pprint")
debugger.lua> p _G.pprint(port)
{
  number = 80,
  protocol = 'tcp',
  reason = 'syn-ack',
  reason_ttl = 63,
  service = 'http',
  state = 'open',
  version = {
    cpe = {},
    name = 'http',
    name_confidence = 3.0,
    service_dtype = 'table',
    service_tunnel = 'none'
  }
}
If we then re-run our Nmap script (we already added our debugger to it previously):
nmap -p 80 192.168.1.1 --script /tmp/http-methods.nse
To view where it is, we can use w and can then use: s to step forward (and into functions) and n to step forward (and skip functions):
debugger.lua> w
 141      test_all_unsafe = stdnse.get_script_args(SCRIPT_NAME .. ".test-all") or false
 142
 143      response = http.generic_request(host, port, "OPTIONS", path)
 144      local dbg = require "debugger"
 145      dbg()
 146 =>   if not response.status then
 147        options_status = false
 148        stdnse.debug1("OPTIONS %s failed.", path)
 149      end
 150      -- Cache in case retest is requested.
 151      if options_status then
debugger.lua> p test_all_unsafe
test_all_unsafe => false
We can use the various debugger commands to step through our NSE script. To repeat any command, just press <ENTER>.
Issues / Caveats
If you place your debug statement before a network-related call and then try to continue running your script, you might see the following instead of your nmap results:
Initiating NSE at 08:44
NSE: Starting http-options against 192.168.1.1:80.
nse_restore: WAITING_TO_RUNNING error!
(null)
QUITTING!
nmap: nsock_pool.c:236: nsock_pool_delete: Assertion `nse->iod->events_pending >= 0' failed.
Aborted (core dumped)
If we move our mobdebug() or dbg() calls to after any network-related calls, we no longer run into this error. For example, if our original code that would crash looked like this:
  require('mobdebug').start("172.17.0.1")
  response = http.generic_request(host, port, "OPTIONS", path)
then changing it to this should decrease the likelihood of this:
  response = http.generic_request(host, port, "OPTIONS", path)
  require('mobdebug').start("172.17.0.1")
I haven’t been able to pinpoint exactly why this happens (feel free to ping me if you do) but it shouldn’t impact us as the main point of debugging is to verify our understanding of how our script works.
Conclusion
In this blog post, we’ve looked at how to how to make debugging NSE scripts a considerably more enjoyable experience. Instead of relying on the default -d and --script-trace flags which provide limited utility in debugging, we’ve successfully attached our NSE scripts to full Lua debuggers, providing us with the ability to view all variables, step through out code, and more.