Lightning Fast Log Enrichment Using Logstash
A look at the fastest ways to enrich logs using Logstash
Introduction
Data Pipeline Management (DPM) solutions allow us to reduce, redact, transform and enrich our data before routing it to its final destination(s). In the cybersecurity field, DPMs are typically used to process data before forwarding it to SIEMs and security data lakes. Low value logs can be dropped to minimize “noise” and minimize cost or they can sent to a data lake or cloud storage for archiving while more important data can find its way to our SIEM.
While Data Pipeline Management solutions such as Cribl and DataBahn have becoming increasingly popular in the SIEM and security data lake spaces, traditional options such as Logstash remain powerful options. While Logstash doesn’t come with a fancy web UI to make building pipelines easier, it can offer much of the same functionality and even excel in certain areas.
Logstash comes with a generous collection of plugins to allow us to ingest logs, slice and dice them, and finally forward them to various destinations. This blog post deep dives into options for enriching logs at scale. It will look at: what are Logstash’s enrichment options and how fast can we make them? Can we get over 100K EPS from a single instance? Unfortunately, a lot of online information related to enrichment is incomplete or inaccurate due to the user not understanding the available options or not understanding some of the limitations of the specific option they selected. I also haven’t seen a comparison of the different options anywhere, which is what this blog post will cover.
Some of the benefits of using Logstash as a DPM include:
- a wide collection of plugins (input, filter and output plugins)
- the ability to extend it with custom code written in JRuby
- high throughput if configured correctly.
However, it does have a learning curve and learning at least some basic understanding of JRuby will make you a lot more effective in using it.
The setup covered here is for a single server. In a production environment, you would typically:
- have a cluster of Logstash servers running behind a load balancer
- configure features such as Persistent Queues which would impact performance. However, there are workarounds to greatly minimize this impact as highlighted in this article.
Performance with No Filters
To set the stage, we’ll first benchmark our Logstash setup and pipeline without any filters or enrichment. The specs of the machine used in our tests is as follows:
- 8 cores at 3.8 GHz with 16 threads
- 32 GB RAM (however, only 2 GB of Java heap memory will be allocated in the
config/jvm.optionsconfiguration file).
To get an idea of the throughput that our machine can generate, we will use the following logstash.yml file for our benchmark:
input {
  generator {
    type => "generated"
    count => 0
  }
}

filter {
  if [type] == "generated" {
     metrics {
       meter => "events"
       add_tag => "metric"
     }
   }
}

output {
  if "metric" in [tags] {
    stdout {
      codec => rubydebug {
        metadata => true
      }
    }
  }
}
Logstash provides a REST API for us to monitor metrics but we’ll just print them to stdout to keep things simple.
When run for a few minutes, we see the following (at this point, performance had largely levelled out):
{
    "@timestamp" => 2025-11-18T01:40:27.000160592Z,
      "@version" => "1",
       "message" => "fedora",
        "events" => {
         "rate_1m" => 195543.01247257556,
        "rate_15m" => 179354.96602444683,
           "count" => 27954601,
         "rate_5m" => 184399.95187329306
    },
          "tags" => [
        [0] "metric"
    ]
}
A sample configuration with no filters allowed us to process over 190,000 EPS (rate_1m). With a beefier setup (more CPUs and more memory allocated to the JVM heap), we should be able to boost these numbers further.
Before looking at our enrichment options, we’ll first look at our sample data. We’ll try to use this data set in most of our benchmark tests.
Our Sample Data
For our enrichment example, we’ll be using the customers-2000000.csv file available over here. This is a CSV file with 2 million custom records, with each record having the following fields:
IndexCustomer IdFirst NameLast NameCompanyCityCountryPhone 1Phone 2EmailSubscription DateWebsite
A sample entry looks like this:
            "Index" => "1"
          "Country" => "British Indian Ocean Territory (Chagos Archipelago)"
      "Customer Id" => "4962fdbE6Bfee6D"
            "Email" => "nicolas00@faulkner-kramer.com"
        "Last Name" => "Sparks"
          "Company" => "Patel-Deleon"
          "Phone 2" => "480-078-0535x889"
       "First Name" => "Pam"
"Subscription Date" => "2020-11-29"
          "Website" => "https://nelson.com/"
          "Phone 1" => "267-243-9490x035"
             "City" => "Blakemouth"
While in many cases our enrichment tables would be much smaller, the reason for having a larger lookup table is to test if our enrichment options can scale in size if needed in addition to dispelling some inaccuracies I’ve seen repeated online.
In a real-life scenario, if we did not need all of these columns, we can easily remove them using Pandas or Polars or any other data analysis library. For example, if we decided that the Phone 2 column is irrelevant, we can remove it with the following short code snippet:
import pandas as pd

INPUT="/tmp/customers-2000000.csv"
OUTPUT="/tmp/customers-2000000.updated.csv"

data = pd.read_csv(INPUT)
data.drop('Phone 2', inplace=True, axis=1)
data.to_csv(OUTPUT, index=False)
It’s now time to start looking at our various enrichment options.
Enrichment Options
Logstash has a number of plugins that can be used to enrich events. These include but are not limited to:
- the translate plugin. This allows us to lookup data stored in CSV, JSON or YAML files
- the memcached plugin which allows us to query a memcached server. memcached is an exceptionally fast in-memory key-value store
- database queries using its two JDBC plugins. This is an attractive option but does come with some limitations. We’ll cover how to overcome these
- the GeoIP plugin which allows us to query MMDB databases such as MaxMind’s popular GeoLite databases. We can also point it to our own custom MMDB databases
- the HTTP plugin which allows us to query a REST API and use the response to enrich our logs
Logstash also allows us to write custom code using JRuby. JRuby is a high performance, stable, fully threaded Java implementation of Ruby that runs on the JVM. All Logstash plugins are written using JRuby and we can write our own custom code which opens up interesting possibilities.
Memcached
The memcached plugin allows us to query a memcached server. Memcached is an exceptionally fast in-memory key-value store. The first challenge we’ll face with using memcached is that memcached supports a single value per key. If we want to enrich our data with all the available fields in our sample data, we would either have to:
- create and query multiple key-value pairs for a single customer
- encode our values and decode them them before using them.
We’ll take the second approach as it results in better performance.
For optimal speed, we’ll run a memcached server on the same machine as our Logstash instance. In one terminal, we will do the following:
wget https://www.memcached.org/files/memcached-1.6.39.tar.gz
tar -zxvf memcached-1.6.39.tar.gz
cd memcached-1.6.39/
./configure
make
and then run it:
$ ./memcached -m 700
The reason that we pass in -m 700 is that, by default, Memcached only allocates 64MB of RAM and will remove items based on LRU once it runs out of memory regardless of whether or not their TTLs have expired! A lot of users may silently be dropping items thinking that they will only expire once the item’s TTL is reached but this isn’t always the case. Why does Memcached do this? Because it handles its memory usage internally instead of relying on the operating system to do so. It requests an initial chunk of memory and then uses only that memory chunk instead of asking for additional chunks when needed. For a detailed look into this, I’d recommend this article.
To overcome this limitation, we’ll keep our keys as they are and base64-encode our other fields to overcome the single value limitation. This simple Python script does the job:
from pymemcache.client import base
import base64
import itertools

client = base.Client(('localhost', 11211))

FILE = "customers-2000000.csv"

with open(FILE) as csv_file:
    # skip first line with header information
    for line in itertools.islice(csv_file, 1, None):
        # split line into 2 sections
        s = line.strip().split(",", 1)
        key = s[0]
        value = base64.b64encode(s[1].encode())
        # print(value)
        client.set(key, value)
In a few seconds, our customer data has been imported. To verify this, we can randomly request a given customer (remember that all customer IDs are between 1 and 2000000):
$ echo 'get 5' | nc localhost 11211
VALUE 5 0 220
RjU3MDJFZGFlOTI1RjFELE1pY2hlbGxlLEJsZXZpbnMsU2hhaCBhbmQgU29ucyxXZXN0IEphcmVkLE1hcnNoYWxsIElzbGFuZHMsODczNTI3ODMyOSwoNjMzKTI4My02MDM0eDUwMCxkaWFtb25kY2FydGVyQGpvcmRhbi5jb20sMjAyMC0xMC0yMCxodHRwOi8vbXVyaWxsby1yeWFuLmNvbS8=
END
Decoding our base64-encoded string gives us the following:
F5702Edae925F1D,Michelle,Blevins,Shah and Sons,West Jared,Marshall Islands,8735278329,(633)283-6034x500,diamondcarter@jordan.com,2020-10-20,http://murillo-ryan.com/
We also want to verify that all our data was added. To do so, we run the following:
$ echo 'stats items' | nc localhost 11211 | grep -i ":number " | cut -d " " -f3 | awk '{s+=$1} END {print s}'
2000000
The sum is equal to 2000000 so we are good to go. If the number was lower, that would indicate that we need more memcached memory as items are being evicted and we would have to restart our memcached server with more memory and reload our data.
And now to our configuration which looks like this:
input {
  generator {
    type => "generated"
    count => 0
  }
}

filter {

  ruby {
    code => '
      # make sure that all hits match our lookup table
      event.set("counter", event.get("[event][sequence]") % 2000000)
    '
  }

  memcached {
    hosts => ["localhost"]
    # hosts => ["/tmp/memcached.sock"]
    get => {
      "%{counter}" => "[@metadata][memcache]"
    }
    add_tag => ["from_cache"]
  }

  if "from_cache" in [tags] {
    ruby {
      code => "
        event.set('[@metadata][base64]', Base64.decode64(event.get('[@metadata][memcache]')))
      "
    }
    csv {
      source => "[@metadata][base64]"
      target => "details"
      separator => ","
      skip_header => "true"
      columns => ["Customer Id","First Name","Last Name","Company","City","Country","Phone 1","Phone 2","Email","Subscription Date","Website"]
    }
  }
  else {
    # if you want to add custom logic for cache misses
  }

  if [type] == "generated" {
     metrics {
       meter => "events"
       add_tag => "metric"
     }
  }
}

output {
  if "metric" in [tags] {
    stdout {
      codec => rubydebug {
        metadata => true
      }
    }
  }
  # stdout { }
}
In our configuration, we do the following:
- use the
countervariable to perform a lookup in memcached and add a tagfrom_cacheif we find a hit - if we did find a hit, we would then:
- base64-decode the value
- use the
csvprocessor to extract the various fields
If we uncomment the stdout in our output, we see a sample entry, verifying that we are correctly enriching our data:
{
      "@version" => "1",
       "message" => "Hello world!",
          "type" => "generated",
    "@timestamp" => 2025-11-11T05:21:37.226089253Z,
       "counter" => 1,
          "tags" => [
        [0] "from_cache"
    ],
          "host" => {
        "name" => "fedora"
    },
       "details" => {
               "First Name" => "Pam",
              "Customer Id" => "4962fdbE6Bfee6D",
                  "Phone 2" => "480-078-0535x889",
                  "Company" => "Patel-Deleon",
                "Last Name" => "Sparks",
                    "Email" => "nicolas00@faulkner-kramer.com",
                  "Phone 1" => "267-243-9490x035",
                  "Website" => "https://nelson.com/",
                  "Country" => "British Indian Ocean Territory (Chagos Archipelago)",
        "Subscription Date" => "2020-11-29",
                     "City" => "Blakemouth"
    },
         "event" => {
        "original" => "Hello world!",
        "sequence" => 0
    }
}
If we benchmark our setup, we see the following:
{
    "@timestamp" => 2025-11-18T03:43:53.562708678Z,
      "@version" => "1",
       "message" => "fedora",
        "events" => {
        "rate_15m" => 8568.804994861723,
         "rate_1m" => 15467.363431965092,
           "count" => 2780126,
         "rate_5m" => 10931.507073206743
    },
          "tags" => [
        [0] "metric"
    ]
}
So we are getting around 15K EPS. Given how fast Memcached is, this is somewhat disappointing. There is an option to have Memcached listen on a Unix socket but this too did not result in faster performance. Fortunately, we have other options which are faster.
Redis
There is no standard support for this but you can do so using the Ruby plugin. Refer to the Ruby plugin section for a simple example. However, given that the memcached did not result in the type of performance we wanted, the Redis option will likely be slower.
Translate
The translate plugin is Logstash’s option for loading key-value pairs in one of the following formats:
- CSV
- JSON
- YAML
and using them for lookups. While most users would immediately go for either the JSON or YAML formats, for any large lookup table, this is a mistake and this is one of the reasons that some users online recommend that you don’t have lookup tables with over 100K entries. Why? Because deserializing a large number of entries takes considerable memory. When I configured it to deserialize 2 million JSON entries, it crashed with heap overflow errors. When I increased the heap size from the default 1 GB to 8 GB, it continued to crash. Meanwhile, the CSV option worked fine with 2 GB heap size (you can set this in config/jvm.options).
However, one key aspect of the CSV format that it expects exactly two columns, with the first serving as the lookup key and the second column as the value. As we have multiple fields associated with any given field, we will base64-encode them and then base64-decode them when reading them in, just as we did when using Memcached.
To convert our original CSV file, we will run the following script:
import base64
import itertools

INPUT = "customers-2000000.csv"
OUTPUT = "customers-2000000.base64.csv"

with open(INPUT) as csv_in:

    with open(OUTPUT, "x") as csv_out:

        # skip first line with header information
        for line in itertools.islice(csv_in, 1, None):
            # split line into 2 sections
            s = line.strip().split(",", 1)
            key = s[0]
            value = base64.b64encode(s[1].encode())
            # print(value)
            line = key + "," + value.decode("ascii") + "\n"
            csv_out.write(line)
The resulting CSV file is roughly 440 MB in size.
Our configuration file is as follows:
input {
  generator {
    type => "generated"
    count => 0
  }
}

filter {

  ruby {
    code => '
      # make sure that all hits match our lookup table
      event.set("counter", event.get("[event][sequence]") % 2000000)
    '
  }

  translate {
    source => "counter"
    target => "[@metadata][translate]"
    dictionary_path => "customers-2000000.base64.csv"
    add_tag => ["from_translate"]
  }

  if "from_translate" in [tags] {
    ruby {
      code => "
        event.set('[@metadata][base64]', Base64.decode64(event.get('[@metadata][translate]')))
      "
    }
    csv {
      source => "[@metadata][base64]"
      target => "details"
      separator => ","
      skip_header => "true"
      columns => ["Customer Id","First Name","Last Name","Company","City","Country","Phone 1","Phone 2","Email","Subscription Date","Website"]
    }
  }

  if [type] == "generated" {
     metrics {
       meter => "events"
       add_tag => "metric"
     }
  }
}

output {
  if "metric" in [tags] {
    stdout {
      codec => rubydebug {
        metadata => true
      }
    }
  }
  # stdout {  }
}
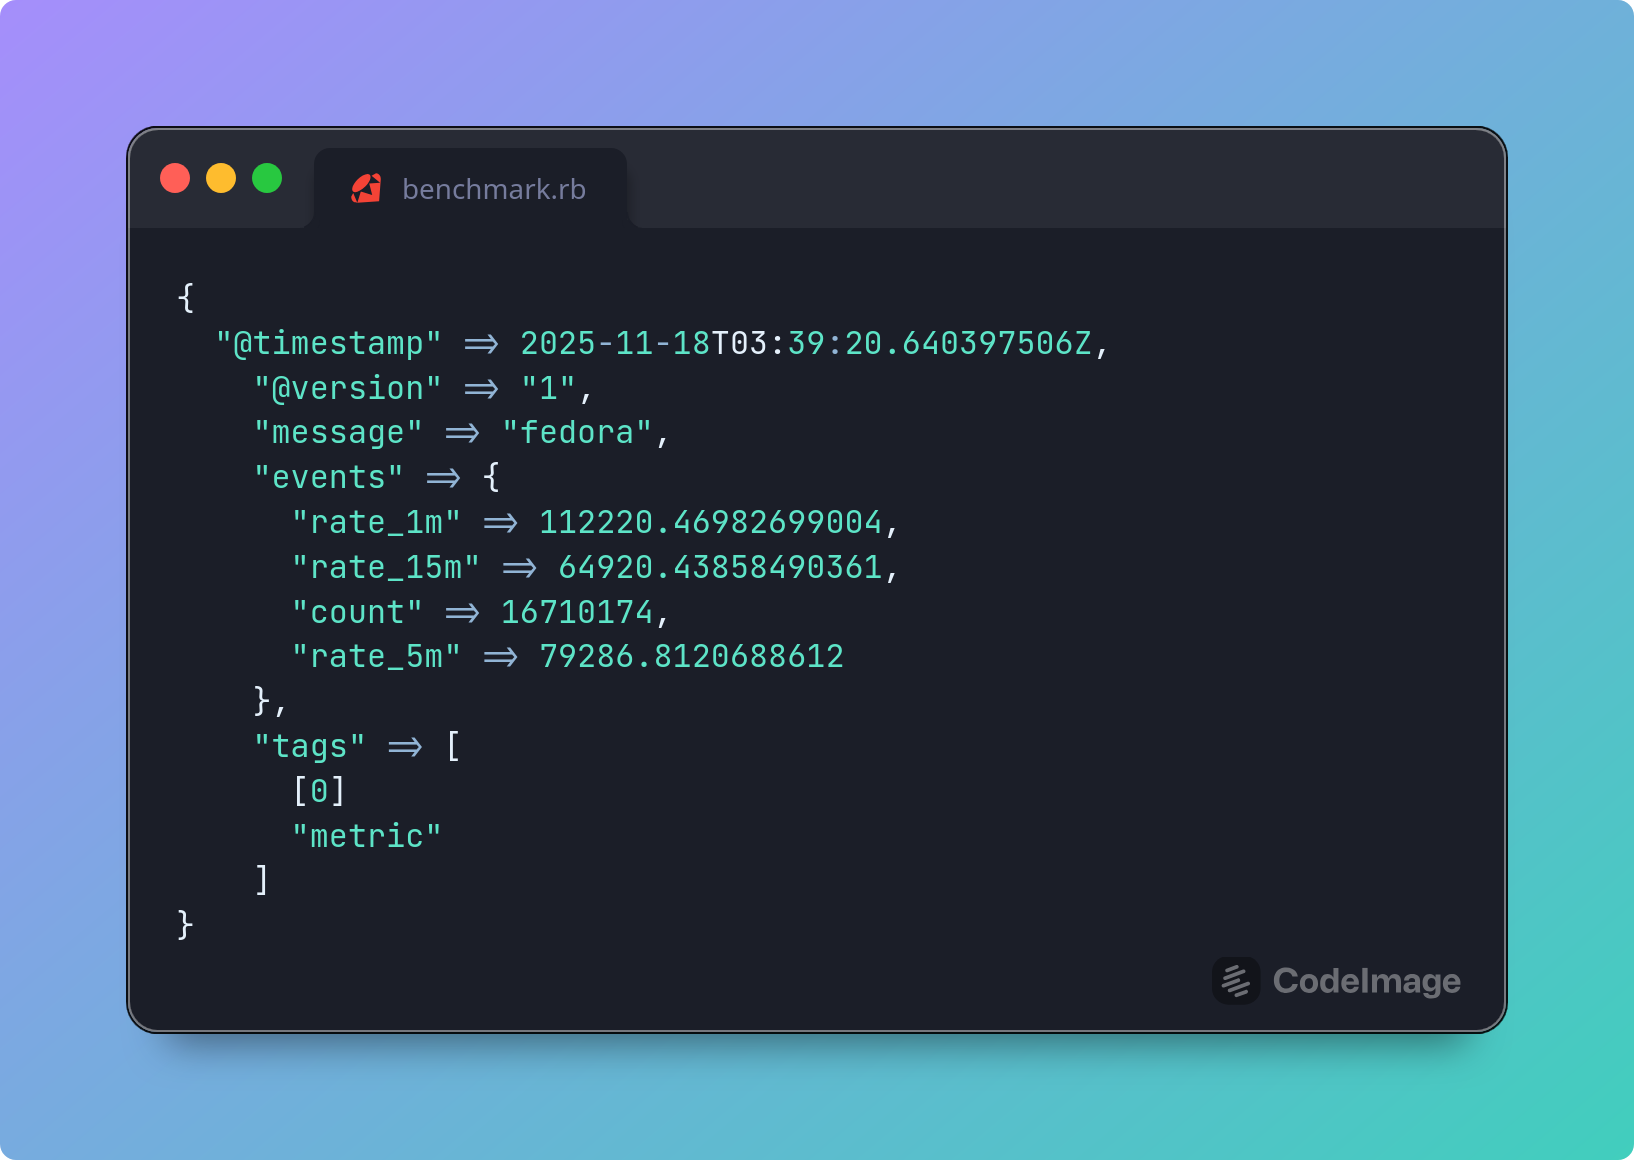
Performance was solid with over 110K EPS:
{
    "@timestamp" => 2025-11-18T03:39:20.640397506Z,
      "@version" => "1",
       "message" => "fedora",
        "events" => {
         "rate_1m" => 112220.46982699004,
        "rate_15m" => 64920.43858490361,
           "count" => 16710174,
         "rate_5m" => 79286.8120688612
    },
          "tags" => [
        [0] "metric"
    ]
}
JDBC
Logstash supports enriching our data using SQL queries on our databases. However, this plugin comes with one glaring limitation: Logstash does not perform connection pooling, which means that our databases could easily be crippled trying to service tens of thousands of requests per second. One possible solution is to front our databases using a database proxy such as:
However, we still have the network overhead of connecting to our proxy and it in turn connecting to our backend database. This would limit our throughput. Instead, we’ll go a different route. We’ll use the most widely used database in the world: SQLite.
Instead of going to our data, we’ll bring our data to us, store it in an SQLite database, and then query it. The actual step of keeping our data up-to-date will not be covered but readers can look into change data capture solutions such as Debezium once the initial data dump has been completed.
In our case, we’ll import our sample CSV file and query it. While we can manually create the DB or use CSV .mode to import the CSV file, I prefer to use the csvs-to-sqlite library as it includes additional features. To do the conversion:
$ pip install csvs-to-sqlite
$ csvs-to-sqlite customers-2000000.csv customers-2000000.db
We then create an index for the field we will use to lookup our customers (the Index field in our case):
$ sqlite3 customers-2000000.db
sqlite> CREATE INDEX idx_customers_2000000 ON "customers-2000000"("Index");
sqlite> .q
Creating an index is critical for performance. On one of my test runs, performance suddenly became excruciatingly slow and I scratched my head trouble-shooting this. I even thought it might be some regression in the JDBC driver. The culprit ended up being that I had forgotten to add an index to the table, thus requiring a full scan of the table (until it found a match).
We can verify that we have an index by running:
SELECT * FROM sqlite_master WHERE type= 'index';
To actually search our SQLite database, Logstash provides us with two plugins:
The jdbc_static plugin is meant for data that rarely changes. It works by caching the data in a local, in-memory Apache Derby database. On the other hand, the jdbc_streaming plugin is meant for databases where changes are more frequent. You would think that jdbc_static would be the obvious choice but from my testing (when used on an SQLite database), it was substantially slower than jdbc_streaming. I’m fairly certain that this is due to some implementation bug in how they use Apache Derby. So we’ll stick with jdbc_streaming.
Before configuring Logstash, we have to download the SQLite JDBC driver, which we can grab from here.
Our configuration would then look like this:
input {
  generator {
    type => "generated"
    count => 0
  }
}

filter {

  ruby {
    code => '
      # make sure that all hits match our lookup table
      event.set("counter", event.get("[event][sequence]") % 2000000)
    '
  }

  jdbc_streaming {
      jdbc_driver_library => "/var/tmp/sqlite-jdbc-3.50.3.0.jar"
      jdbc_driver_class => "org.sqlite.JDBC"
      jdbc_connection_string => "jdbc:sqlite:/var/tmp/customers-20000000.db"
      jdbc_user => ""
      statement => 'SELECT * FROM "customers-2000000" WHERE "Index" = :id'
      parameters => { "id" => "[counter]" }
      use_cache => false
      target => "db_output"
  }

  if [type] == "generated" {
     metrics {
       meter => "events"
       add_tag => "metric"
     }
  }
}

output {
  if "metric" in [tags] {
    stdout {
      codec => rubydebug {
        metadata => true
      }
    }
  }
  # stdout { }
}
If we uncommented the stdout, we would see sample logs such as this:
{
      "@version" => "1",
    "@timestamp" => 2025-11-11T04:43:08.338573827Z,
       "message" => "Hello world!",
          "type" => "generated",
         "event" => {
        "sequence" => 1,
        "original" => "Hello world!"
    },
          "host" => {
        "name" => "fedora"
    },
     "db_output" => [
        [0] {
                   "First Name" => "Pam",
                        "Email" => "nicolas00@faulkner-kramer.com",
                      "Phone 2" => "480-078-0535x889",
            "Subscription Date" => "2020-11-29",
                    "Last Name" => "Sparks",
                      "Phone 1" => "267-243-9490x035",
                      "Website" => "https://nelson.com/",
                  "Customer Id" => "4962fdbE6Bfee6D",
                      "Company" => "Patel-Deleon",
                         "City" => "Blakemouth",
                      "Country" => "British Indian Ocean Territory (Chagos Archipelago)",
                        "Index" => 1
        }
    ]
}
Performance is a very respectable 37K:
{
    "@timestamp" => 2025-11-18T03:58:31.840457261Z,
      "@version" => "1",
       "message" => "fedora",
        "events" => {
        "rate_15m" => 28152.45170024643,
         "rate_1m" => 37741.36038589728,
           "count" => 7271855,
         "rate_5m" => 31660.887014242493
    },
          "tags" => [
        [0] "metric"
    ]
}
However, there is a setting above that I used to intentionally limit performance in real-world scenarios and which astute readers may have picked up on; I disabled the internal cache. The jdbc_streaming plugin supports maintaining an LRU cache. By default, it is limited to 500 entries but this is configurable. In real-world scenarios, you will likely run into the same customer multiple times and enabling this and configuring its size adequately can significantly improve performance (if most of your customers end up in the cache, you can more than double or even triple your performance).
This solution also excels in that in needs minimal memory compared to other options as the database is not loaded into memory.
IP / GeoIP Enrichment
If we want to enrich data using IPs as keys and need the absolute best performance possible, then forget all the other options. The top two options here are:
- the CIDR plugin if we are just interested in determining whether a given IP address falls in a specific CIDR range.
- the GeoIP if we are interested in GeoIP enrichment.
While Logstash comes with the free MaxMind GeoLite2 MMDB databases, we can also:
- point it at any of the commercial MaxMind databases if we have a license for them. For example, MaxMind offers the following commercial databases:
- GeoIP Enterprise database with more accurate GeoIP details
- GeoIP Anonymous IP database to detect Tor exit nodes, VPNs, public proxies and hosting providers / data centers
- point it to our own custom MMDB databases.
Using our own custom MMDB databases allows us to:
- cover internal / private IP addresses such as internal networks
- add custom fields such as user details
- add IP-related IoCs.
There are a number of libraries to build these including MaxMind-DB-Writer-python and Go MaxMind DB Writer.
Out of the box, the GeoIP plugin caches up to 1000 lookups (the cache_size is configurable). To make things as slow as possible (to push Logstash as much as much as possible), we will:
- set the
cache_sizeto 1 (this is the smallest supportedcache_size) - generate random IP addresses using the popular Faker Ruby library.
We first install the Faker library:
./bin/ruby vendor/jruby/bin/bundler add faker
As our customer data seen above does not have IP addresses, we will instead generate IP addresses and enrich them. Our configuration file looks like this:
input {
  generator {
    type => "generated"
    count => 0
  }
}

filter {
  ruby {
    init => 'require "faker"'
    code => "
      begin
        event.set('clientip', Faker::Internet.ip_v4_address)
      rescue => e
        event.tag('_rubyexception')
        event.set('ruby_error_message', e.message)
        event.set('ruby_error_backtrace', e.backtrace.join('\\n'))
      end
    "
  }

  geoip {
       cache_size => 1
       source => "clientip"
       target => "geoip"
  }

  if [type] == "generated" {
     metrics {
       meter => "events"
       add_tag => "metric"
     }
   }
}

output {
  if "metric" in [tags] {
    stdout {
      codec => rubydebug {
        metadata => true
      }
    }
  }
  # stdout {  }
}
and this is a sample output (if we uncommented the stdout output):
{
       "message" => "Hello world!",
          "type" => "generated",
          "host" => {
        "name" => "fedora"
    },
      "clientip" => "120.175.8.56",
      "@version" => "1",
         "event" => {
        "sequence" => 0,
        "original" => "Hello world!"
    },
    "@timestamp" => 2025-11-11T02:26:07.779507846Z,
         "geoip" => {
        "geo" => {
                "country_name" => "Indonesia",
                    "timezone" => "Asia/Jakarta",
              "continent_code" => "AS",
            "country_iso_code" => "ID",
                    "location" => {
                "lat" => -6.175,
                "lon" => 106.8286
            }
        },
         "ip" => "120.175.8.56"
    }
}
Performance is impressive as shown below (with over 140K EPS):
{
    "@timestamp" => 2025-11-18T04:03:17.353446289Z,
      "@version" => "1",
       "message" => "fedora",
        "events" => {
        "rate_15m" => 146866.48399579996,
         "rate_1m" => 164558.9816850313,
           "count" => 11548996,
         "rate_5m" => 150534.6360232002
    },
          "tags" => [
        [0] "metric"
    ]
}
In real-world conditions, performance would be even better as an IP address is rarely seen once and the cache would kick in to service the lookup instead of requiring a database hit. Ironically, given the performance shown above, the documentation claims the following: “GeoIP lookup is surprisingly expensive. This filter uses an cache to take advantage of the fact that IPs agents are often found adjacent to one another in log files and rarely have a random distribution. The higher you set this the more likely an item is to be in the cache and the faster this filter will run”. I’d say the performance is perfectly fine even without the cache.
HTTP
The HTTP filter allows us to send requests to HTTP endpoints and enrich our logs with the responses. To stress-test the throughput of the HTTP filter, we need an exceptionally fast web application and web server. The sample setup I previously covered here where I developed an application that is a subset of Have I Been Pwned and meets this criteria. When benchmarking the web app using the wrk benchmarking tool, we were able to hit 94K EPS.
To compare how well Logstash would perform with the same application, we would configure and run our web application (refer to the blog post for setup details) and then run the following Logstash configuration (using the default settings):
input {
  generator {
    type => "generated"
    lines => [
      # should find a match
      "http://localhost:8080/hash/0CB4ACE5A8894BB6966E6FDABB2237C9DD771C43",
      # should not find a match
      "http://localhost:8080/hash/F8517D0EF5B383BD83571C7809D202D2014DA7DA"
    ]
    count => 0
  }
}

filter {
  http {
    url => "%{message}"
    verb => "GET"
    target_body => "found_hash"
  }

  if [type] == "generated" {
     metrics {
       meter => "events"
       add_tag => "metric"
     }
   }
}

output {
  if "metric" in [tags] {
    stdout {
      codec => rubydebug {
        metadata => true
      }
    }
  }
  # stdout { codec => rubydebug }
}
The results are impressive, with over 80K EPS:
{
    "@timestamp" => 2025-11-18T01:24:26.911701106Z,
      "@version" => "1",
       "message" => "fedora",
        "events" => {
         "rate_1m" => 87091.49799691423,
        "rate_15m" => 63521.05187313155,
           "count" => 9734811,
         "rate_5m" => 69480.00705178971
    },
          "tags" => [
        [0] "metric"
    ]
}
In real life, we will be constrained by the following factors:
- the web application tier
- the code run by our application and
- there is no caching option for this plugin.
However, if we are able to optimize the first two options here by caching within our application, then the HTTP filter plugin provides us with solid performance.
Astute readers may also realise that using this option, we can extend Logstash using any language of choice. By developing our logic / solution in Go or Rust or Python and fronting it with a fast web application tier (or using a fast embedded HTTP server), we can continue to work in our language of preference to extend Logstash’s functionality.
Ruby
One of my favorite features in Logstash is its support for processing events using JRuby. JRuby is a high performance, stable, fully threaded Java implementation of Ruby that runs on the JVM. Allowing us to write code using JRuby makes Logstash exceptionally flexible, especially when combined with its ability to install and use third-party libraries (gems). As it runs on the JVM, not all third-party Ruby libraries are supported (plugins that use C extensions are not supported) but a substantial number of libraries are supported.
Using this is ideal for handling:
- enriching events from sources for which there is no filter plugin (Redis for example)
- adding custom business logic
- performing advanced string processing
- performing advanced data sanitization
and other tasks not supported by other filter plugins.
For example, out of the box, there is no Redis support. Adding support for this is as straight-forward as installing the redis gem:
$ ./bin/ruby vendor/jruby/bin/bundler add redis
and then connecting to it using the Ruby filter:
filter {
  ruby {
    init => 'require "redis"; $rc = Redis.new(host: "172.17.0.3", db: 0)'
    code => 'event.set("enriched_field", $rc.get(event.get("key_field")))'
  }
}
We’ve also seen snippets of it in other examples in this blog such as shown in the GeoIP section where we use the Faker library to generate fake IPv4 addresses.
While very powerful, if there are any shared variables or data structures between different threads, we should keep in mind concurrency issues (refer to this for more) so we don’t unintentionally shoot ourselves in the foot.
Finally, all plugins are written in JRuby. This means that we can see excellent performance.
Conclusion
As seen above, log enrichment using Logstash can be exceptionally fast, typically hitting over 50K EPS and sometimes over 100K EPS. This is per node.
If you are currently a user of the Elastic Stack, Elasticsearch itself supports enrichment on event ingest via Elasticsearch Ingest Pipelines. This allows us to upload our data to an Elasticsearch index and then use it to enrich incoming logs using the Enrich processor. Performance is solid (I benchmarked it at over 50K EPS). However, it does not provide you with the ability to:
- use a database to enrich your logs
- forward low value logs to a data lake or cloud storage without cluttering Elasticsearch
- use custom JRuby code (it does support some scripting in the form of Painless scripting but this is very limited compared to JRuby).
So whether you should use Logstash or just rely on Ingest Pipelines depends on your needs.
When looking at DPMs, the question is: do you need all the bells and whistles that other options such as Cribl provide is putting in the effort to learn and use Logstash a better investment?
Finally, with additional tweaking, you can squeeze even more performance out of Logstash. These may be covered in a future blog post.